
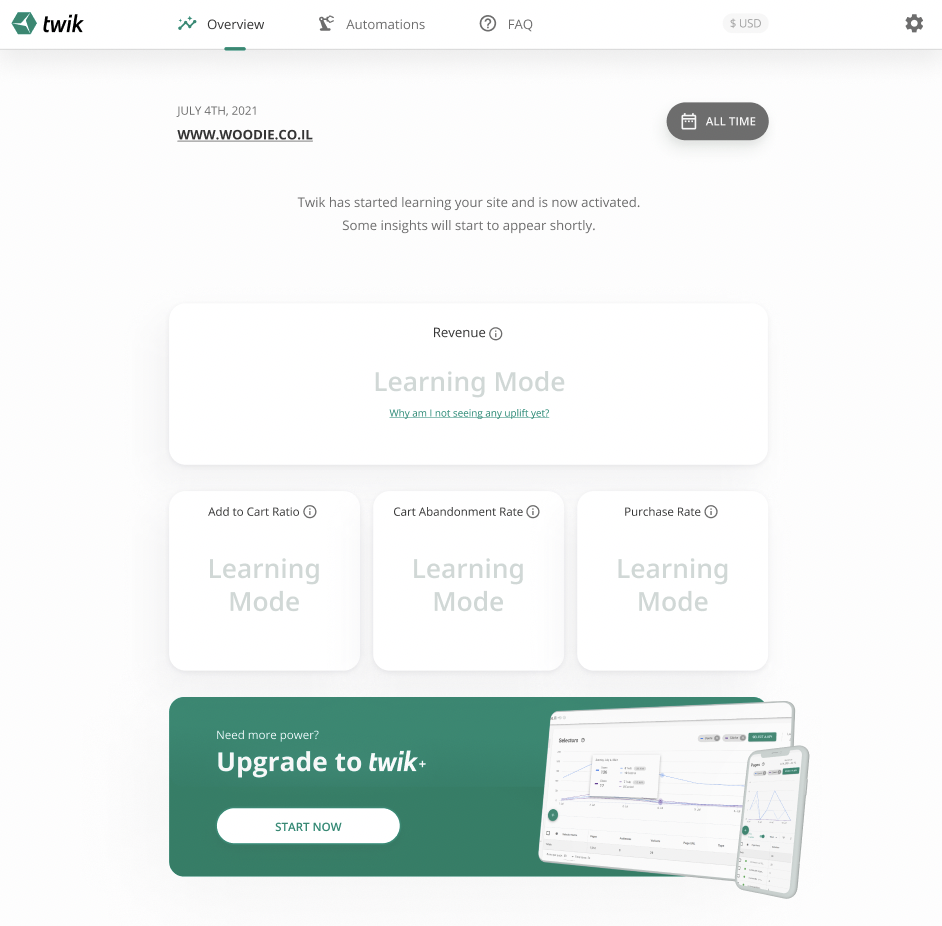
This is the first Overview page you will see after the welcome page. Under the Overview tab, you’re able to view your KPIs (Key Performance Indicators) and deeper insights into each one of your KPIs. That being said, you’ve only just started, so it will take some time until you see values in the Overview tab, as twik AI-ML algorithms need time to learn your store. You also have the option to upgrade to twik+ at the bottom of the page.
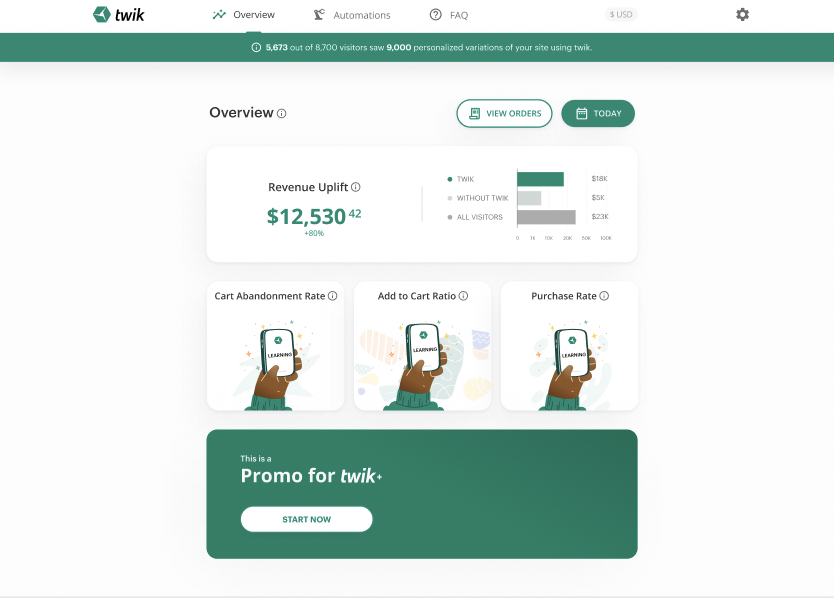
At this point, your KPIs begin to unravel as twik has learned more about your store. The only KPI with a value is your revenue uplift, which is the increase in your revenue since installing twik, or in a given selected time frame.
The revenue uplift box has a few components. The main one is the value in dollars and beneath that you have the uplift value as a percentage. So in this example, the store owner had $12,530.42 or 80% increase in revenue uplift. To the right of these values, you’re also able to see a bar graph of how the revenue uplift divides into different groups:
The bar labeled ‘twik’ shows the revenue uplift derived from users that have been exposed to personalization. ‘Without twik’ presents the revenue uplift received by users that were strategically concealed from personalization, or in other words the “control” group. The bar labeled ‘all visitors’ represents the total revenue uplift made by the ‘twik’ group, ‘without twik’ group, and all other visitors in the selected time frame that purchased at least one product from your store.
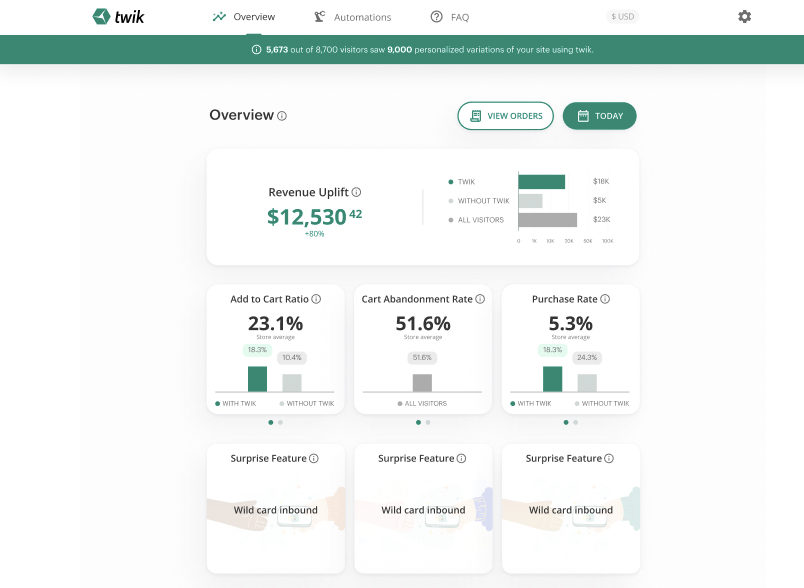
This is what your Overview tab will look like once twik has learned your store enough to give you full insights. The accuracy of these insights increase the longer twik is learning your store, AKA, the longer twik is installed.
Now, let’s take a look at the time frame and past orders.
At the top right corner of your Overview tab, click on the calendar icon with the words ‘All Time” to select a specific time frame.
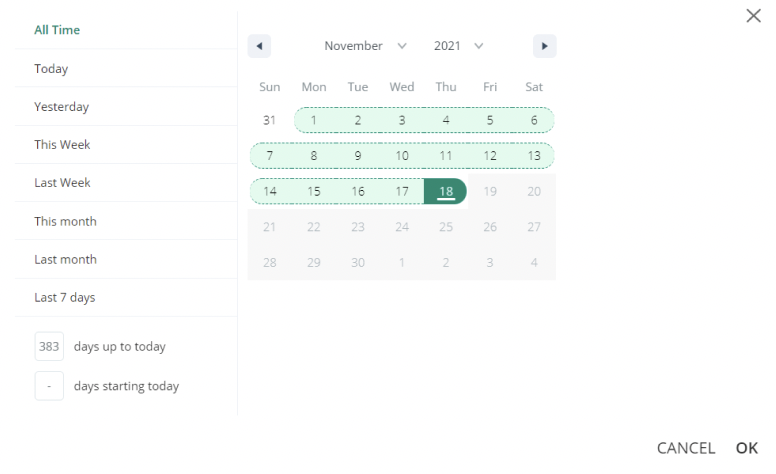
You have a few options in selecting time frames here. On the left side, you have predefined time frame options, like ‘This Week’ or ‘This Month’. Below those options you can also enter a particular number of days up to today or starting today, or you can select your time frame manually on the calendar. Once you’ve selected your desired time frame, click OK on the bottom right hand corner of the Calendar overlay to save changes. Note that the default for the calendar is All Time, meaning since you’ve installed twik.
To the left of the calendar button, you’ll see a button called ‘View Orders’. Click this button to view your past transactions.
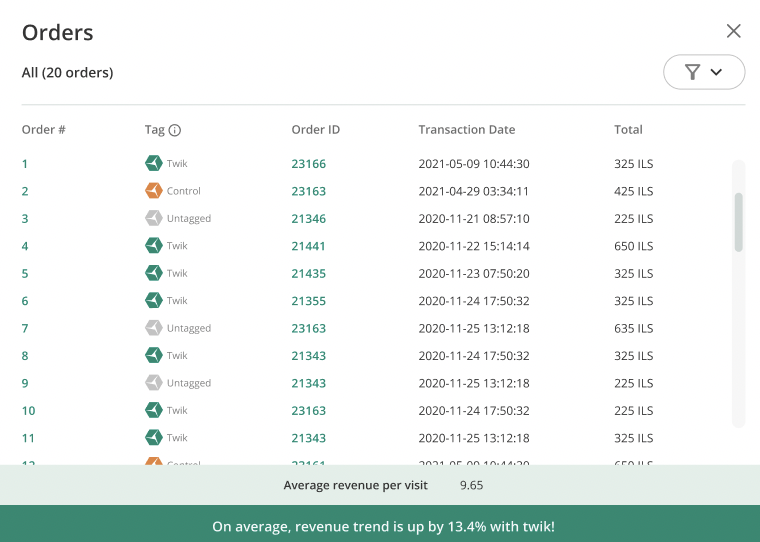
In this section, you’re able to view detailed information about the different orders made within the selected time frame. You can see the total number of orders in the time frame, the average revenue per visit, and how much your revenue increased with twik.
You’re also able to see order number, order ID, transaction date and time, the transaction total, and type of tag, which consists of three options – Twik, Control, and Untagged. The Twik tag are orders made by users that had been exposed to personalization, the Control tag are orders made by users that were purposefully concealed from personalization, and the Untagged tag defines orders that were made by users that were not segmented into relevant groups, and therefore not exposed to personalization.
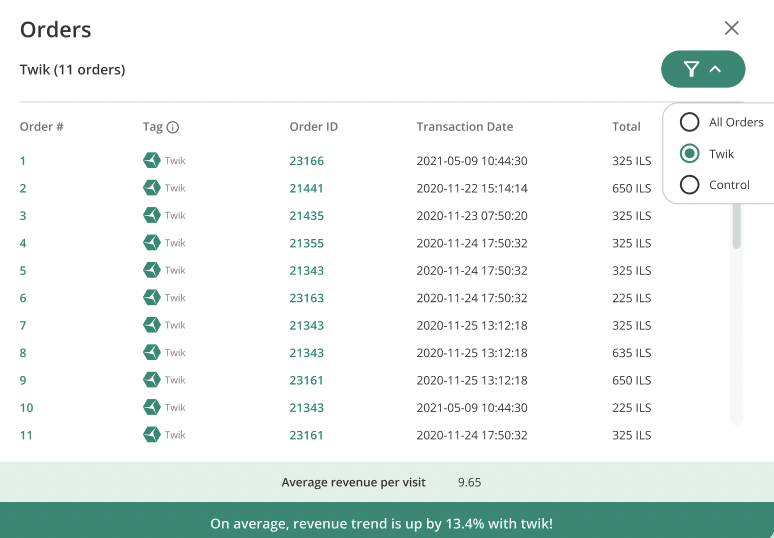
On the top left hand side of the View Orders section, you’re able to filter orders based on their tag type.