
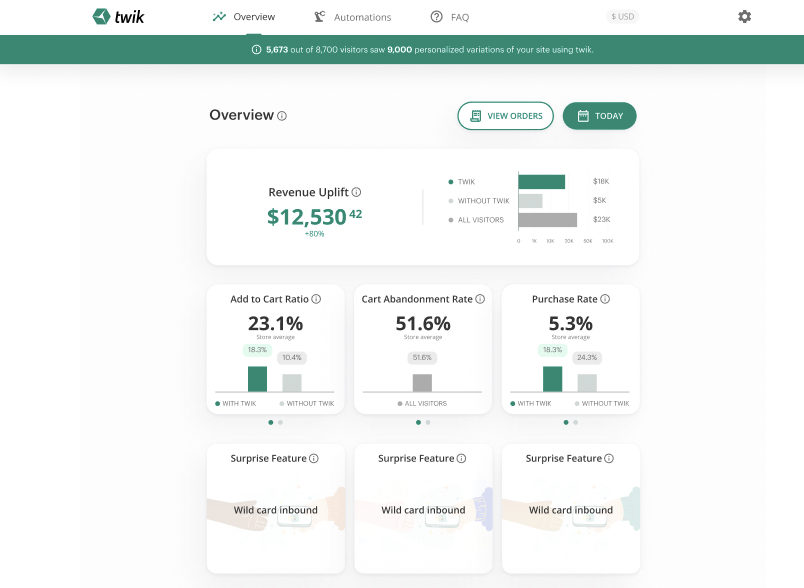
Once twik learns a bit more about your store, your Overview tab will look something like this, where you can see various KPIs. Note that the KPIs presented in the picture will not necessarily be the same KPIs that you will see in your Overview tab, because they change based on your specific store information and which KPIs are the most relevant for your store. The only KPI that will always be at the top, for every twik user, is revenue uplift. You can also always hover over the little (i) icon next to revenue uplift to present further information on it.
The possible KPIs you might see in your Overview tab include:
Revenue Uplift – the increase in your revenue since installing twik, or in a given selected time frame.
Add to Cart Ratio – Percentage of users who place at least one item in their cart in the selected time frame.
Cart Abandonment Rate – Percentage of users that add items to their shopping cart and leave before completing the checkout process.
Purchase Rate – Number of successful purchases on the store divided by the total number of visits.
Revisit Rate – Percentage of users who visited the store more than once in the selected time frame.
Wishlist Rate – Percentage of users who added at least one item to their wishlist.
Registration Rate – Percentage of users who visited the store and completed the registration process successfully.
Average Transaction – The average value of transactions made in the selected time frame.
Some KPIs might not appear in your Overview tab, or only appear after a certain period of time, depending on your store type and traffic behavior. For each exposed KPI, you’ll see a value and bar graph, similar to how revenue uplift is presented. Note that all KPIs will be presented based on the time frame you’ve selected, and if you haven’t selected one, it will default to All Time, meaning since you installed twik.
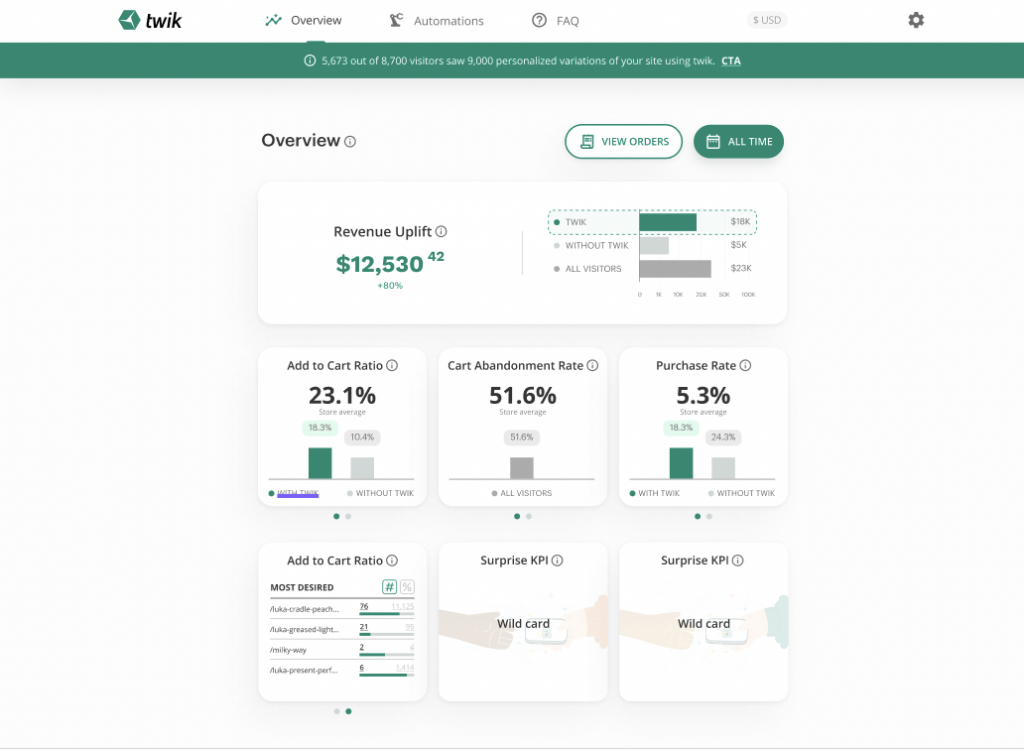
When you click on any KPI (other than revenue uplift) you’ll notice a kind of flip occurs, showing you deeper insights into the selected KPI. Each flip is different for each KPI, but each one of them will show 4 relevant orders, and you can choose to see the values in whole numbers or percentages.